Sample Response One
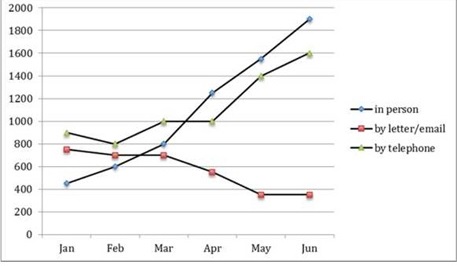
The provided line graph depicts the distribution of questionnaires administered to a travel center in one specific area over the course of six months in 2011. In summary, the number of inquiries made in person and via telephone experienced a gradual increase, while there was a slight decrease in the volume of letters and emails seeking information.
Going into further detail, in January, telephone inquiries were the most common type, reaching a peak at 1000. Subsequently, from January to April, there was some fluctuation, with the number of telephone inquiries remaining between 800 and 1000. Following this period, there was a noticeable uptick, with the number of telephone inquiries rising from 1000 to 1600 over a two-month period. Additionally, in January, in-person inquiries were the least frequent, but they surged to approximately 2000 in June. Before March, in-person inquiries overtook letters in volume, and after March, they surpassed phone-based inquiries.
Conversely, letters were the second most prevalent type of inquiry in January, with a count of 800. Following this, there was a period of stability at 800, but over the next four months, the volume of letters gradually declined, ultimately reaching 400.
Sample Response Two
The provided line graph illustrates the distribution of questionnaires distributed to a travel center in one specific area over a six-month period in 2011. In summary, there was a gradual increase in the number of in-person and telephone inquiries, while there was a slight decline in the volume of letters and emails requesting information.
Delving into the specifics, in January, telephone inquiries were the most common type, totaling 1000. Subsequently, from January to April, there was some fluctuation, with telephone inquiries remaining within the range of 800 to 1000. Following this period, there was a modest increase, with telephone inquiries rising from 1000 to 1600 over the course of two months. Additionally, in January, in-person inquiries were the least frequent, but they experienced a substantial surge, reaching approximately 2000 in June. Before March, in-person inquiries surpassed letters in volume, and after March, they even exceeded phone-based inquiries.
On the other hand, letters were the second most prevalent type of inquiry in January, with a count of 800. Following this, there was a period of stability at 800, but over the subsequent four months, the volume of letters gradually decreased, ultimately reaching 400.
Sample Response Three
The line graph provides an overview of tourist inquiries made at the Tourist Information Office in a specific city from January to June 2011. There are three primary methods visitors can use to make these queries: in-person, via letter/email, or by telephone. Notably, these channels were relatively less utilized in the first month, with lower figures. However, a significant shift in the pattern occurred as in-person and telephone inquiries experienced substantial growth throughout the following months, while queries via letter/email exhibited the opposite trend.
In January, the highest number of inquiries, surpassing 800, were made by telephone. This number fluctuated over several months until April, after which it gradually increased, culminating in 1600 inquiries. In contrast, inquiries made via writing a letter or email remained just below 800. This figure held steady for the subsequent two months before dropping to its lowest point in May and June, with fewer than 400 inquiries.
Conversely, the number of in-person inquiries started at just over 400 in January, representing the lowest figure. However, there was a fivefold increase in the number of tourist queries, peaking in June and ending with slightly less than 2000 inquiries.
Sample Response Four
The line graph provides an overview of tourist inquiries made at the Tourist Information office in a particular city from January to June 2011.
In general, when considering the available methods for making inquiries, tourists displayed a clear preference for asking questions in person, as opposed to using letters/emails or telephones. Notably, the number of written inquiries gradually declined throughout the survey period, in contrast to the trends observed for the other two channels.
To start, in January, there were 400 inquiries made in person, which steadily increased to over 1800 by the end of the survey in June. Similarly, telephone inquiries started at around 900 in the first month, dipped to 800, and then rebounded to remain at 1000 in March and April. However, despite this rise, the number of inquiries made via telephone could not match those made in person, accounting for 1600 inquiries in June.
Lastly, written inquiries began at approximately 800 in January but experienced a slight decrease to less than 600 in April. Afterward, they remained relatively stable at less than 400 from May until the end of the survey period.
Sample Response Five
The line chart depicts the number of inquiries directed to the Tourist Information Office through three communication methods (in person, by letter or email, and by phone) in a specific city during the first half of 2011.
In general, inquiries were predominantly made by visitors in person and via phone, while written emails and letters were the less popular choices. Additionally, the most notable shift occurred in the number of in-person inquiries.
In January, there were 900 telephone inquiries made to the Tourist Information Office at the beginning of the period, gradually increasing to approximately 1600 in June. In contrast, only 400 letters and emails were sent to the tourist authority in January. The number of in-person inquiries increased significantly over the next three months, peaking at around 2000 inquiries, making it the most popular platform by the end of the period. In contrast, the number of written emails and letters steadily declined throughout the period, reaching a low point of 390 queries in May and June.
Sample Response Six
The graph illustrates the number of inquiries received by the Tourist Information Office in a city over a six-month period in 2011.
In general, the three distinct lines on the graph represent three different methods through which tourists sought information. Notably, there was a significant increase in inquiries received in person, while the number of inquiries received by letter or email showed a decreasing trend.
In January, the Tourist Information Office received approximately 450 inquiries in person, while around 790 inquiries were sent via email or letter. Telephone inquiries were the most popular, with 900 calls recorded. In the following two months, the number of in-person inquiries steadily increased to 800 meetings, but it did not surpass the number of telephone inquiries.
From April to June, there was a noticeable decline in the number of inquiries received via letter or email. In contrast, the office continued to receive a substantial number of inquiries in person and via telephone. Moreover, the data highlighted a significant increase in the number of inquiries received in person, making it the leading method by June, with a total of 1900 inquiries.
Sample Response Seven
The provided line chart illustrates the number of inquiries received by the tourist information office in an urban area over a six-month period in 2011.
In general, there is a clear distinction in the trends of inquiries sent through different channels. The number of telephone inquiries decreased, while the opposite trend is observed for inquiries made in person and via letter or email. Additionally, after March, the number of in-person inquiries surpassed the other two methods.
In January, the highest number of inquiries, approximately 900, was made via telephone, while inquiries made in person and via letter or email were nearly 800 and over 400, respectively. From January to March, the number of in-person inquiries gradually increased, followed by a dramatic surge to approximately 1900 in June, making it the predominant method for inquiries in the office.
On the other hand, telephone inquiries experienced some fluctuations, hovering between 800 and 1000 during the first four months, followed by a clear increase to 1600 by the end of the period. Meanwhile, the number of inquiries made via letter or email gradually declined to approximately 400 and remained stable until the end of the six-month period.
Sample Response Eight
The chart provides an overview of the number of inquiries made to the Tourist Information Office in a specific city from January to June 2011. Inquiries were categorized into three types: in-person, telephone, and email/written correspondence.
In general, telephone and in-person inquiries witnessed an increase during this period, while email and written correspondence inquiries declined.
In January, the Tourist Information Office received around 800 inquiries via telephone, while in-person inquiries numbered half as many. The number of telephone inquiries experienced slight fluctuations until April when it began to rise significantly, reaching approximately 1100 inquiries by June. In contrast, in-person inquiries surpassed telephone inquiries in March and continued to climb, peaking at around 1200 inquiries in June.
Conversely, the number of email and letter inquiries saw a slight decline from January to March, followed by a more pronounced decrease in the subsequent months. By June, the figure for email and letter inquiries had dropped to approximately 200.
Sample Response Nine
The following chart illustrates an overview of tourist questions in a tourist center during the first half of 2011.
Overall, tourists ask their questions by three various ways, that is, in person, by telephone, and by letter. The first two methods had an increasing trend during these 6 months, while written and email enquiries were less prominent.
The number of people enquiries in person was approximately 450 in January (the minimum numbers compared to others). There was a significant growth in the number of in person enquiries, reaching 1900 in June (maximum number compare to others).In January, the number of telephone questions was around 900 then it experienced a slight decrease to 800. Following this dip, there was a gradual increase to 1000 in May and maintaining this level until Apr. After that, there was a notable upward from Apr to Jun and achieved to 1600.
The inclination of people to ask their questions by letter/ email witnessed a slight downward to approximately 700 in Feb remaining constant until Mar. It then declined to around 390 in Mar and stayed this level until Jun.